Compute Pretty Simulations Summary Table
Source:R/summary_nflseedR.R
summary.nflseedR_simulation.RdUses the R package gt to create a pretty html table of the nflseedR simulation summary data frame.
Usage
# S3 method for class 'nflseedR_simulation'
summary(object, ...)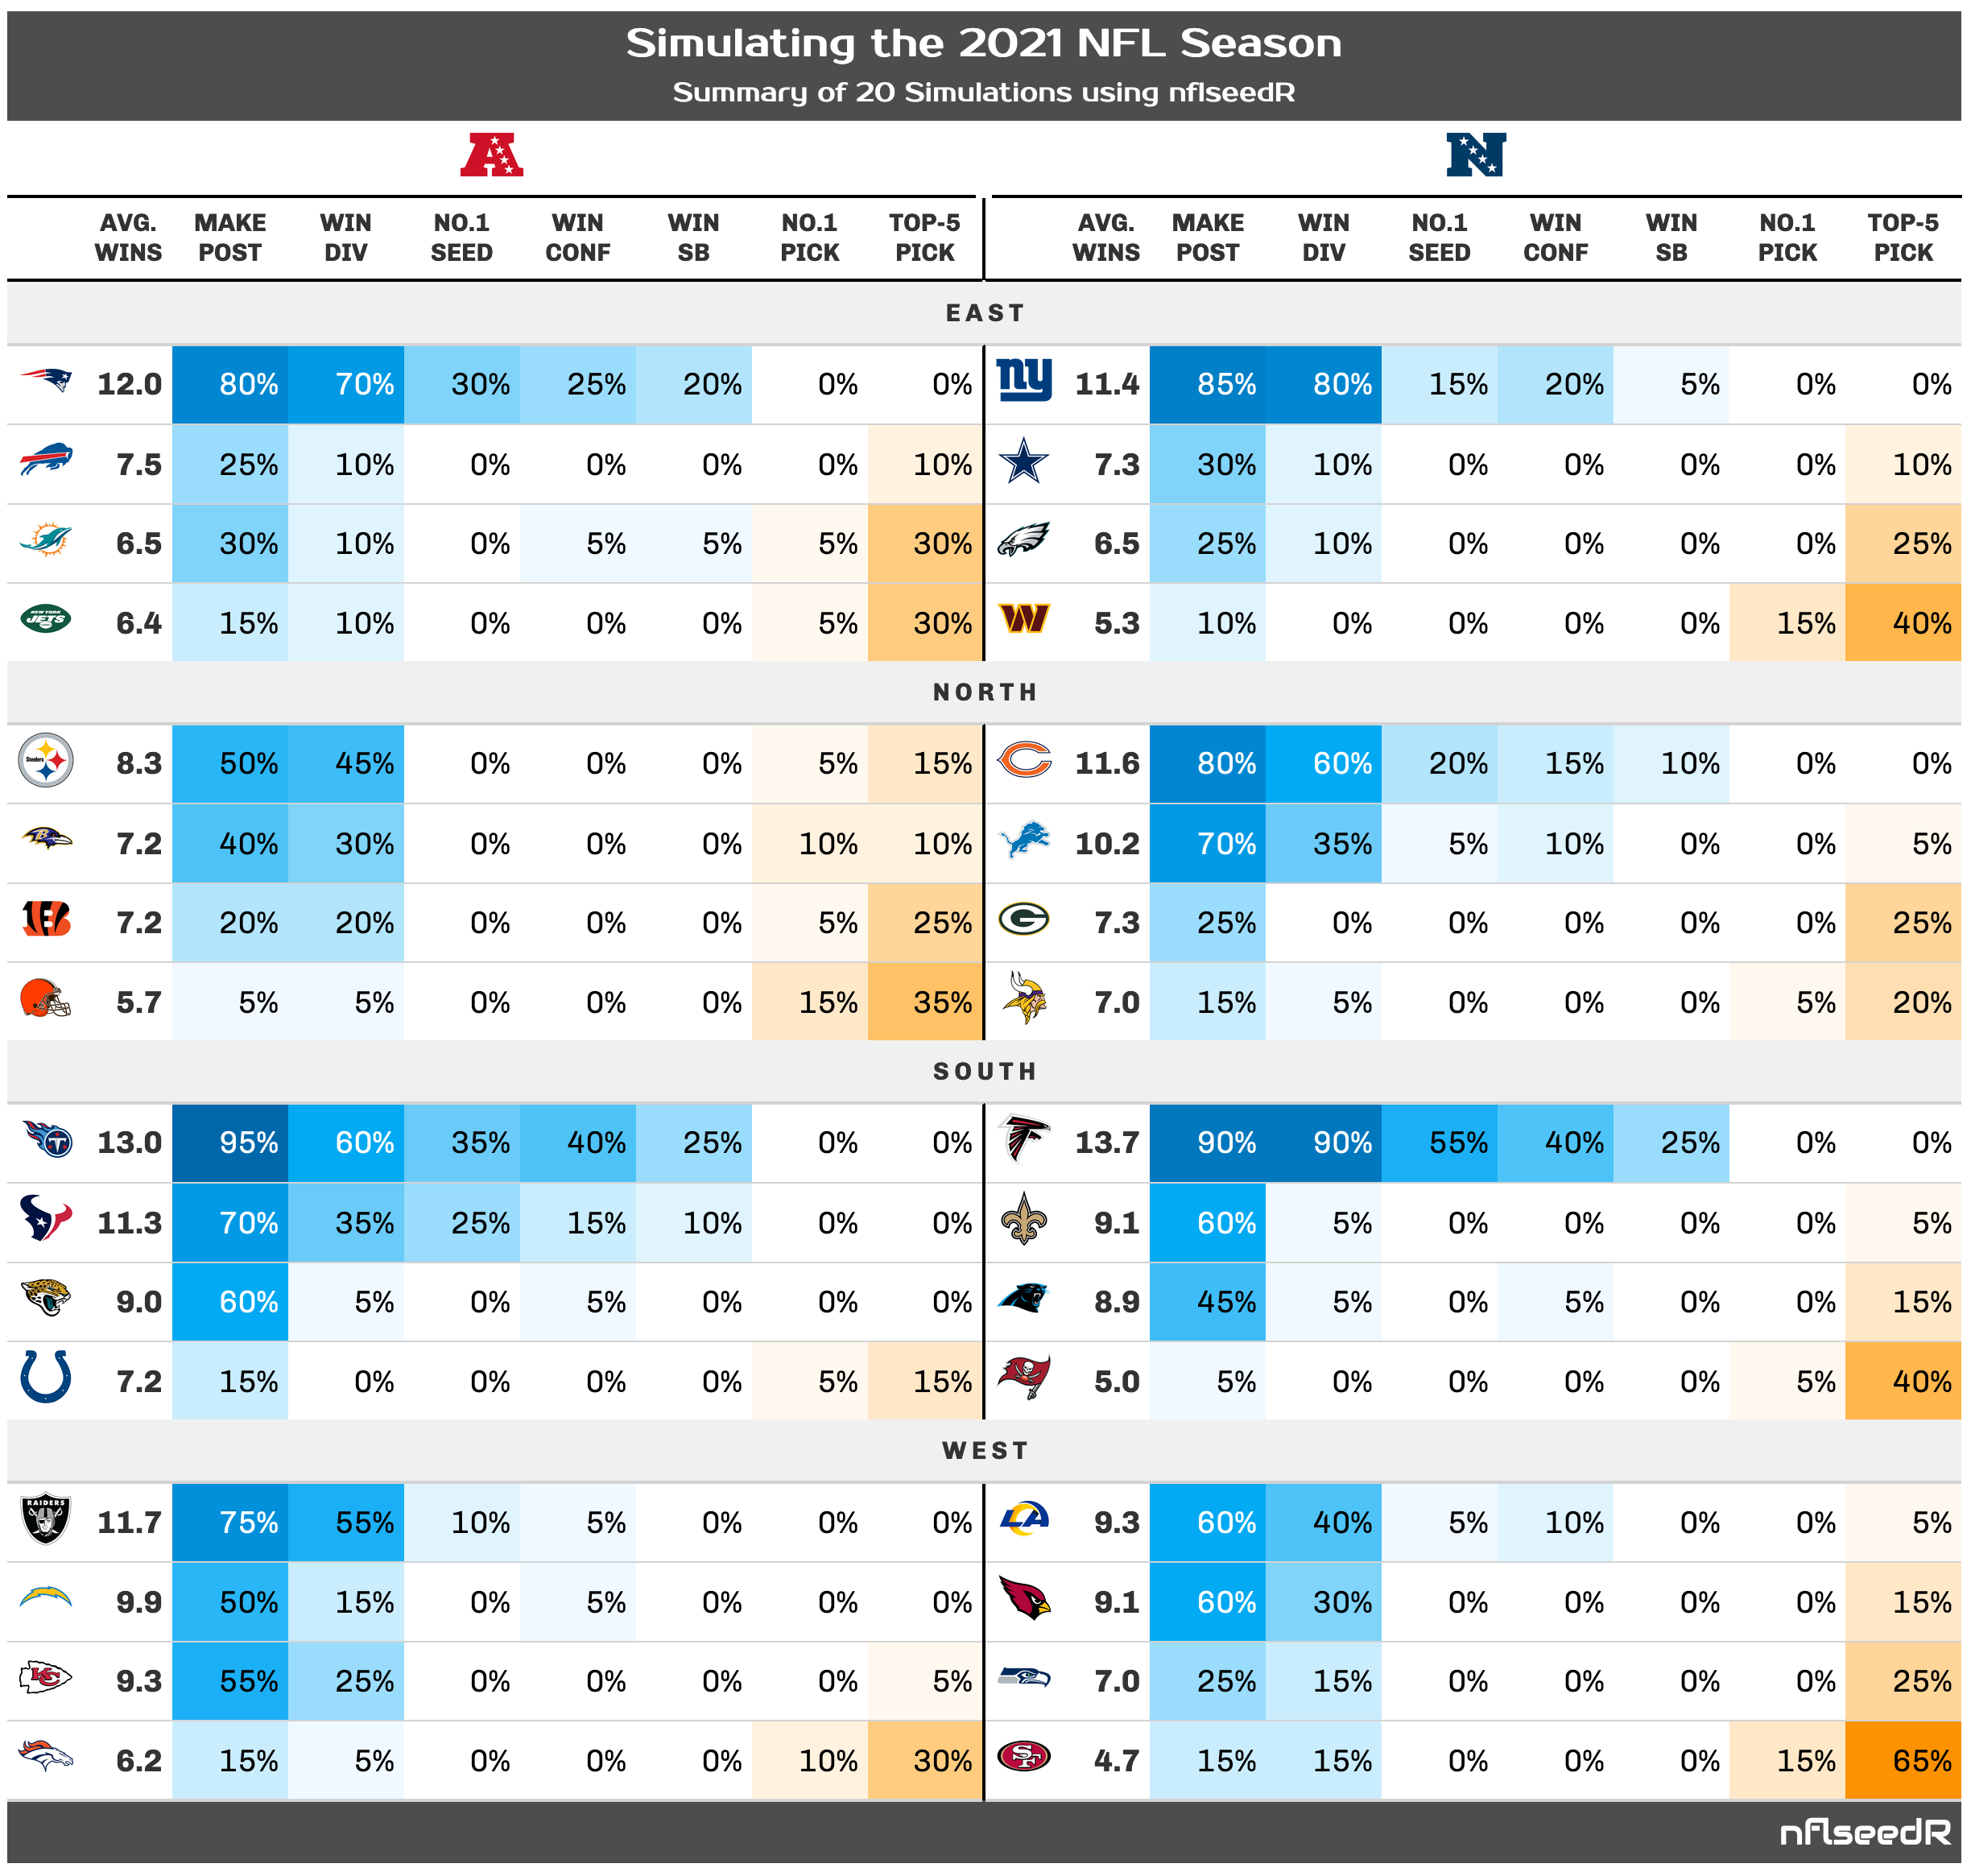
Examples
# \donttest{
library(nflseedR)
# set seed for recreation,
# internal parallelization requires a L'Ecuyer-CMRG random number generator
set.seed(19980310, kind = "L'Ecuyer-CMRG")

# Simulate the season 20 times in 1 round
sim <- nflseedR::simulate_nfl(
  nfl_season = 2021,
  fresh_season = TRUE,
  simulations = 20
)
#> ℹ 14:09:37 | Loading games data
#> ℹ 14:09:38 | Beginning simulation of 20 seasons in 1 round
#> ℹ 14:09:45 | Combining simulation data
#> ℹ 14:09:45 | Aggregating across simulations
#> ℹ 14:09:45 | DONE!

# Create Summary Tables
tbl <- summary(sim)

# The output of tbl is given in the above image.
# }